FAQs
如果您在使用大禹系统过程中遇到问题,请遵循以下步骤排查定位具体问题,并根据FAQ解决:
✅ 检查 Dayu Pods: 使用 kubectl get pods -n <your-dayu-namespace> 检查大禹核心容器的状态;
并使用 kubectl logs <pod-name> -n <your-dayu-namespace> 和 kubectl describes pod <pod-name> -n <your-dayu-namespace> 排查异常状态容器的日志信息;
✅ 检查 Dayu 核心资源: 如果容器Pods在未知错误状态,可以使用 kubectl get svc -n <your-dayu-namespace> 和 kubectl get deployment -n <your-dayu-namespace> 检查 services 和 deployments 等核心资源状态;
✅ 检查节点连通性: 使用 kubectl get nodes 检查云边分布式系统中的节点连接状态 ('Ready' 或 'Not Ready');
✅ 检查 Sedna: 使用 kubectl get pods -n sedna -owide 和 kubectl logs <sedna-pod-name> -n sedna 检查 Sedna gm 组件和 lc 组件的日志;
✅ 检查 EdgeMesh: 如果大禹系统中节点间通讯阻塞,使用 kubectl get pods -n kubeedge -owide 和 kubectl logs <edgemesh-pod-name> -n kubeedge检查 EdgeMesh agent 的日志;
✅ 检查 Cloudcore: 在云服务器上使用 systemctl status cloudcore 或 journalctl -u cloudcore -xe 检查 cloudcore 是否正常运行没有报错;
✅ 检查 Edgecore: 在边缘节点上使用 systemctl status edgecore 或 journalctl -u edgecore -xe 检查 edgecore 是否正常运行没有报错;
✅ 检查 Kubelet 在云服务器上使用 systemctl status kubelet 或 journalctl -u kubelet -xe 检查 k8s 的核心管理服务 kubelet 是否正常运行没有报错
✅ 检查 Docker: 如果 kubectl 指令和其他 k8s 指令均无法正常执行,通过 docker ps -a 检查docker容器状态,通过 systemctl status docker 和 journalctl -u docker -xe检查 docker 服务状态和日志。
问题一:kube-proxy 报 iptables 问题
E0627 09:28:54.054930 1 proxier.go:1598] Failed to execute iptables-restore: exit status 1 (iptables-restore: line 86 failed ) I0627 09:28:54.054962 1 proxier.go:879] Sync failed; retrying in 30s
解决: 直接清理 iptables:
iptables -F && iptables -t nat -F && iptables -t mangle -F && iptables -X
问题二:calico 和 coredns 一直处于初始化
用 kubectl describe <podname> 应该会有 failed 的报错,大致内容是跟 network 和 sandbox 相关的。
Failed to create pod sandbox: rpc error: code = Unknown desc = [failed to set up sandbox container "7f5b66ebecdfc2c206027a2afcb9d1a58ec5db1a6a10a91d4d60c0079236e401" network for pod "calico-kube-controllers-577f77cb5c-99t8z": networkPlugin cni failed to set up pod "calico-kube-controllers-577f77cb5c-99t8z_kube-system" network: error getting ClusterInformation: Get "https://[10.96.0.1]:443/apis/crd.projectcalico.org/v1/clusterinformations/default": dial tcp 10.96.0. 1:443: i/o timeout, failed to clean up sandbox container "7f5b66ebecdfc2c206027a2afcb9d1a58ec5db1a6a10a91d4d60c0079236e401" network for pod "calico-kube-controllers-577f77cb5c-99t8z": networkPlugin cni failed to teardown pod "calico-kube-controllers-577f77cb5c-99t8z_kube-system" network: error getting ClusterInformation: Get "https://[10.96.0.1]:443/apis/crd.projectcalico.org/v1/clusterinformations/default": dial tcp 10.96.0. 1:443: i/o timeout]
原因: 应该不是第一次初始化 k8s 集群,所以会遇到这样的问题。出现的原因是之前没有删除 k8s 的网络配置。
解决:
# 删除网络配置
rm -rf /etc/cni/net.d/
# 可能需要重新init一下
问题三:metrics-server一直无法成功
原因: master 没有加污点。
解决:
kubectl taint nodes --all node-role.kubernetes.io/master node-role.kubernetes.io/master-
问题四:10002 already in use
journalctl -u cloudcore.service -xe 时看到 xxx already in use。
原因: 应该是之前的记录没有清理干净。
解决: 找到占用端口的进程,直接 Kill 即可:
lsof -i:xxxx
kill xxxxx
问题五:edgecore 符号链接已存在
execute keadm command failed: failed to exec 'bash -c sudo ln /etc/kubeedge/edgecore.service /etc/systemd/system/edgecore.service && sudo systemctl daemon-reload && sudo systemctl enable edgecore && sudo systemctl start edgecore', err: ln: failed to create hard link '/etc/systemd/system/edgecore.service': File exists, err: exit status 1
在尝试创建符号链接时,目标路径已经存在,因此无法创建。这通常是因为 edgecore.service 已经存在于 /etc/systemd/system/ 目录中。
解决:
sudo rm /etc/systemd/system/edgecore.service
问题六:缺少 TLSStreamCertFile
 TLSStreamPrivateKeyFile: Invalid value: "/etc/kubeedge/certs/stream.key": TLSStreamPrivateKeyFile not exist
12月 14 23:02:23 cloud.kubeedge cloudcore[196229]:   TLSStreamCertFile: Invalid value: "/etc/kubeedge/certs/stream.crt": TLSStreamCertFile not exist
12月 14 23:02:23 cloud.kubeedge cloudcore[196229]:   TLSStreamCAFile: Invalid value: "/etc/kubeedge/ca/streamCA.crt": TLSStreamCAFile not exist
12月 14 23:02:23 cloud.kubeedge cloudcore[196229]: ]
解决:
查看 /etc/kubeedge 下是否有 certgen.sh 并且 bash certgen.sh stream。
问题七:edgemesh 的 log 边边互联成功,云边无法连接
排查:
先复习一下定位模型,确定被访问节点上的 edgemesh-agent容器是否存在、是否处于正常运行中。
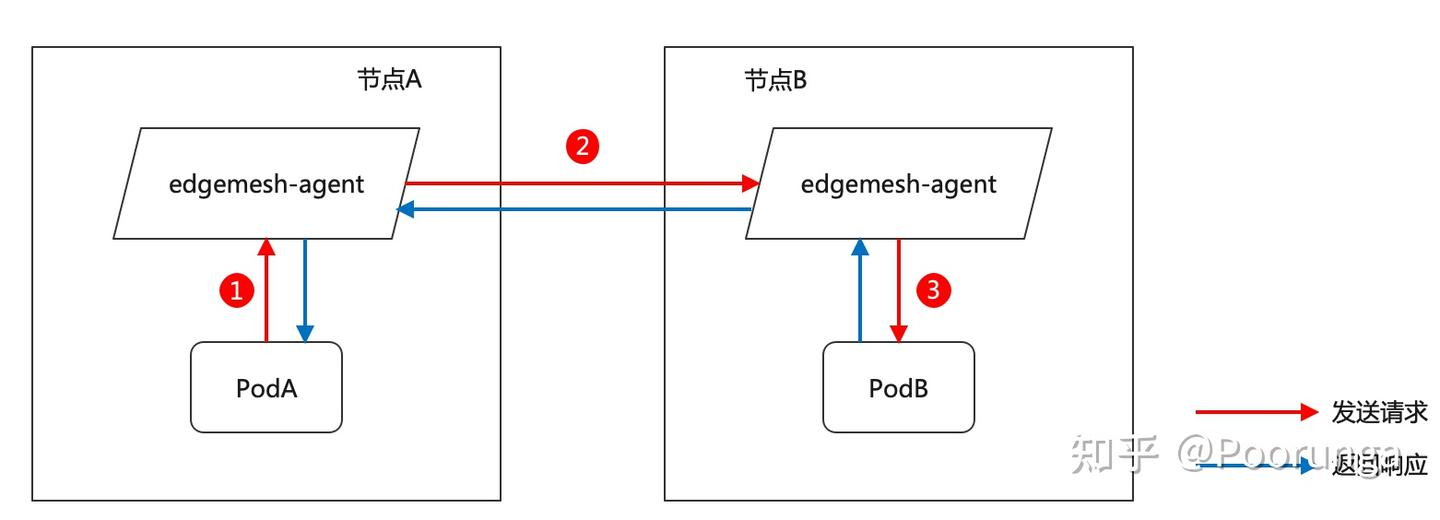
这个情况是非常经常出现的,因为 master 节点一般都有污点,会驱逐其他 pod,进而导致 edgemesh-agent 部署不上去。这种情况可以通过去除节点污点,使 edgemesh-agent 部署上去解决。
如果访问节点和被访问节点的 edgemesh-agent 都正常启动了,但是还报这个错误,可能是因为访问节点和被访问节点没有互相发现导致,请这样排查:
- 首先每个节点上的 edgemesh-agent 都具有 peer ID,比如:
edge1:
I'm {12D3KooWFz1dKY8L3JC8wAY6sJ5MswvPEGKysPCfcaGxFmeH7wkz: [/ip4/127.0.0.1/tcp/20006 /ip4/192.168.1.2/tcp/20006]}

edge2:
I'm {12D3KooWPpY4GqqNF3sLC397fMz5ZZfxmtMTNa1gLYFopWbHxZDt: [/ip4/127.0.0.1/tcp/20006 /ip4/192.168.1.4/tcp/20006]}

注意:
a. peer ID是根据节点名称哈希出来的,相同的节点名称会哈希出相同的peer ID
b. 另外,节点名称不是服务器名称,是k8s node name,请用kubectl get nodes查看
-
如果访问节点和被访问节点处于同一个局域网内(所有节点应该具备内网 IP(10.0.0.0/8、172.16.0.0/12、192.168.0.0/16),请看全网最全EdgeMesh Q&A手册 - 知乎 (zhihu.com)中的问题十二,同一个局域网内 edgemesh-agent 互相发现对方时的日志是
[MDNS] Discovery found peer: <被访问端peer ID: [被访问端IP列表(可能会包含中继节点IP)]>。 -
如果访问节点和被访问节点跨子网,这时候应该看看 relayNodes 设置的正不正确,为什么中继节点没办法协助两个节点交换 peer 信息。详细材料请阅读:KubeEdge EdgeMesh 高可用架构详解。跨子网的 edgemesh-agent 互相发现对方时的日志是
[DHT] Discovery found peer: <被访问端peer ID: [被访问端IP列表(可能会包含中继节点IP)]>。
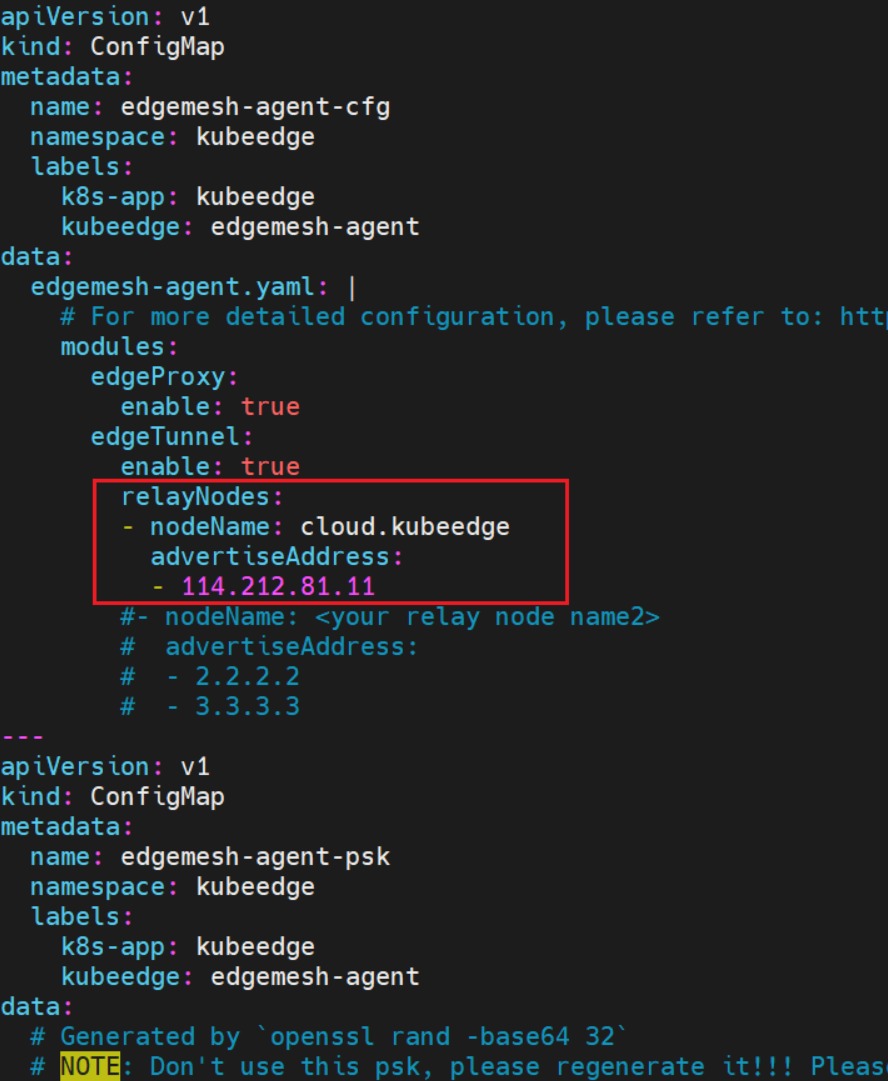
解决:
在部署 edgemesh 进行 kubectl apply -f build/agent/resources/ 操作时,修改 04-configmap.yaml,添加 relayNode(根本原因在于,不符合“访问节点和被访问节点处于同一个局域网内”,所以需要添加 relayNode)。
问题八:master 的gpu 存在但是找不到 gpu 资源
主要针对的是云服务器的gpu使用情况,可以使用 nvidia-smi 查看服务器显卡情况,云服务器上的k8s pod需要使用GPU需要额外的插件支持。
参考如下链接: Installing the NVIDIA Container Toolkit — NVIDIA Container Toolkit 1.14.3 documentation
按上述内容进行配置,然后还需要 vim /etc/docker/daemon.json,添加 default-runtime:
{
    "default-runtime": "nvidia",
    "runtimes": {
        "nvidia": {
            "args": [],
            "path": "nvidia-container-runtime"
        }
    }
}
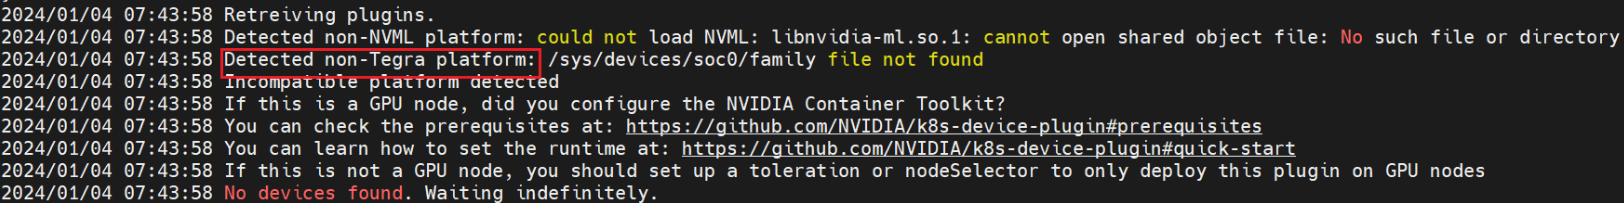
问题九:jeston 的 gpu 存在但是找不到 gpu 资源
理论上 k8s-device-plugin 已经支持了 tegra 即 jetson 系列板子,会在查看 GPU 之前判断是否是 tegra 架构,,但是log显示未检测到 tegra 架构:
2024/01/04 07:43:58 Retreiving plugins.
2024/01/04 07:43:58 Detected non-NVML platform: could not load NVML: libnvidia-ml.so.1: cannot open shared object file: No such file or directory
2024/01/04 07:43:58 Detected non-Tegra platform: /sys/devices/soc0/family file not found
2024/01/04 07:43:58 Incompatible platform detected
2024/01/04 07:43:58 If this is a GPU node, did you configure the NVIDIA Container Toolkit?
2024/01/04 07:43:58 You can check the prerequisites at: https://github.com/NVIDIA/k8s-device-plugin#prerequisites
2024/01/04 07:43:58 You can learn how to set the runtime at: https://github.com/NVIDIA/k8s-device-plugin#quick-start
2024/01/04 07:43:58 If this is not a GPU node, you should set up a toleration or nodeSelector to only deploy this plugin on GPU nodes
2024/01/04 07:43:58 No devices found. Waiting indefinitely.
dpkg -l '*nvidia*'
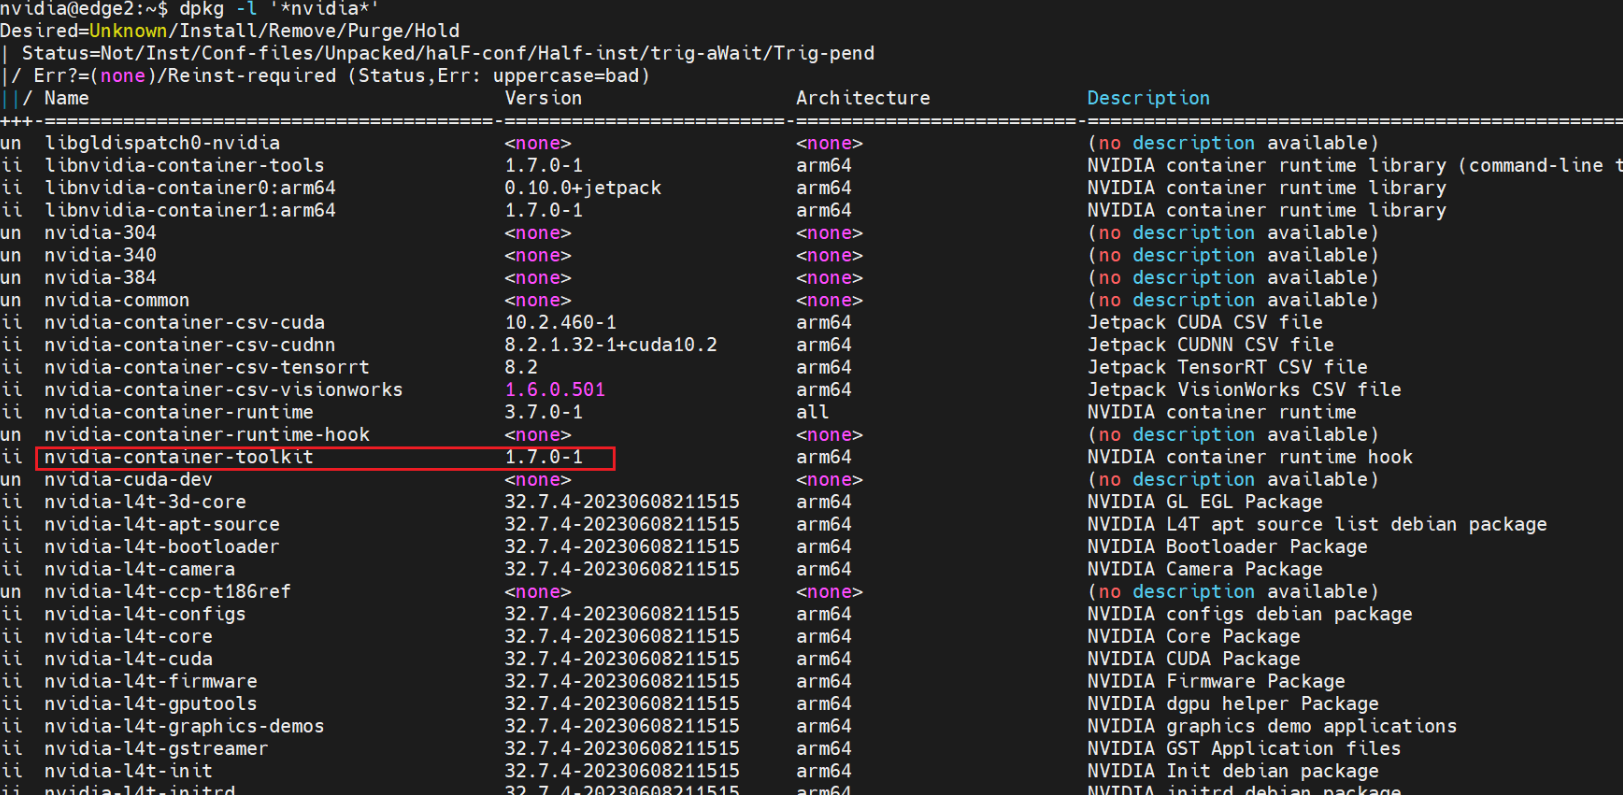
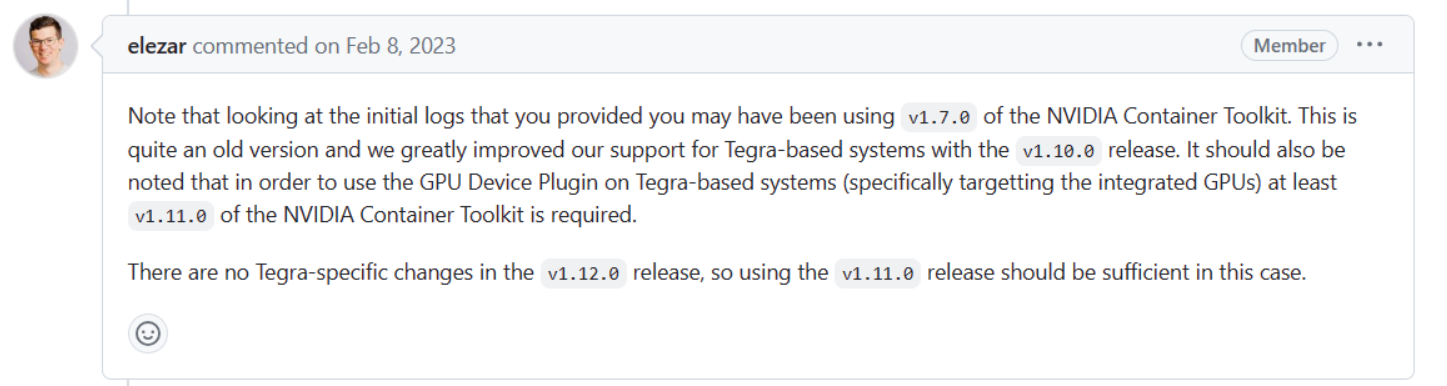
Note that looking at the initial logs that you provided you may have been using
v1.7.0of the NVIDIA Container Toolkit. This is quite an old version and we greatly improved our support for Tegra-based systems with thev1.10.0release. It should also be noted that in order to use the GPU Device Plugin on Tegra-based systems (specifically targetting the integrated GPUs) at leastv1.11.0of the NVIDIA Container Toolkit is required.There are no Tegra-specific changes in the
v1.12.0release, so using thev1.11.0release should be sufficient in this case.
解决: 需要升级NVIDIA Container Toolkit:
curl -fsSL https://nvidia.github.io/libnvidia-container/gpgkey | sudo gpg --dearmor -o /usr/share/keyrings/nvidia-container-toolkit-keyring.gpg \
  && curl -s -L https://nvidia.github.io/libnvidia-container/stable/deb/nvidia-container-toolkit.list | \
    sed 's#deb https://#deb [signed-by=/usr/share/keyrings/nvidia-container-toolkit-keyring.gpg] https://#g' | \
    sudo tee /etc/apt/sources.list.d/nvidia-container-toolkit.list

sudo apt-get update

sudo apt-get install -y nvidia-container-toolkit
问题十:lc127.0.0. 53:53 no such host/connection refused
在安装Sedna阶段,检查正确性时报错lc127.0.0. 53:53 no such host/connection refused。
原因: 错误原理参见链接中的问题五。
解决:
首先,检查准备阶段中的Sedna安装脚本install.sh,观察其中是否有Hostnetwork键值对,如果没有,一般说明不会有问题(dayu定制版sedna仓库中的install.sh是没有这个问题的)。
如果确认没有这个键值对却依然报错,按照如下方法暂时解决问题(不推荐):
(1)在边/云(取决于是哪一个sedna的pod出问题了)用vim /etc/resolv.conf打开文件,然后在文件最后一行添加nameserver 169.254.96.16,哪怕文件中本来就有nameserver键。但是一般不推荐这样做。
(2)再去边端用vim /etc/kubeedge/config/edgecore.yaml打开edgecore.yaml,查看edge部分的clusterDNS内是否对应169.254.96.16,有没有被覆盖。如果没覆盖就成功。
(3)在这之后,如果是边端上的pod出问题,就要重装sedna,先delete再create。
问题十一:169.254.96.16:no such host
检查 edgemesh 的配置是否正确:
- 检查 iptables 的链的顺序如混合代理 | EdgeMesh 所示
- 着重检查 EdgeMesh安装中的
clusterDNS
问题十二: kubectl logs <pod-name> 超时
![]()
原因: 借鉴 Kubernetes 边缘节点抓不到监控指标?试试这个方法! - 知乎 (zhihu.com)
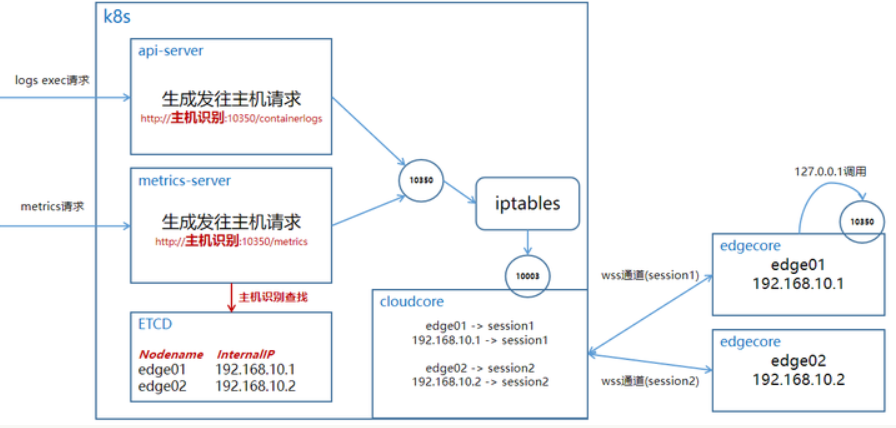
可以发现报错访问的端口就是 10350,而在 kubeedge 中 10350 应该会进行转发,所以应该是 cloudcore 的设置问题。
解决: Enable Kubectl logs/exec to debug pods on the edge | KubeEdge 根据这个链接设置即可。
问题十三: kubectl logs <pod-name> 卡住
原因: 可能由于之前 kubectl logs 时未结束就 ctrl+c 结束了导致后续卡住。
解决: 重启 edgecore/cloudcore:
# 在云端
systemctl restart cloudcore.service
# 在边端
systemctl restart edgecore.service
问题十四:CloudCore报certficate错误
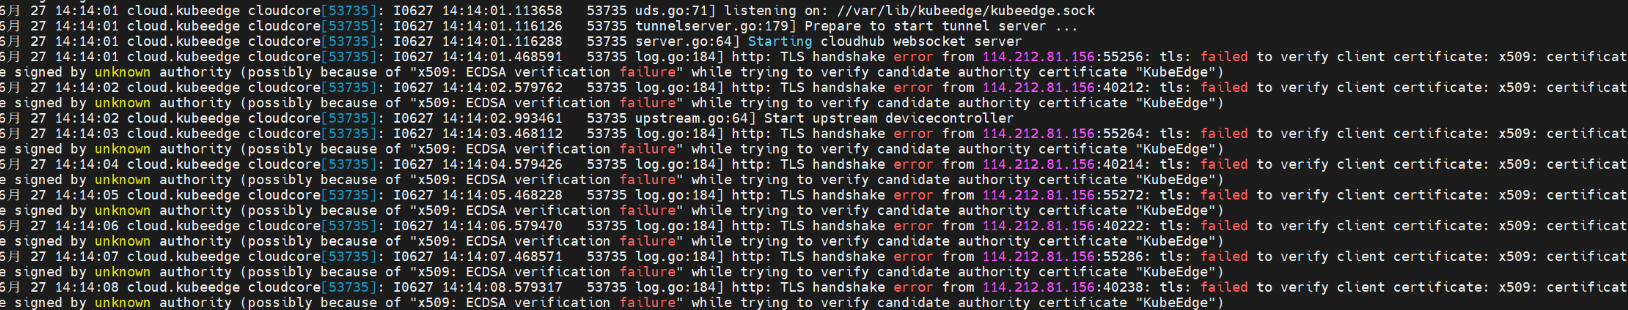
原因: 因为reset环境后主节点 token 变了,但是边缘节点一直以过去的 token 尝试进行连接。
解决: 边端获取并使用新的 token 连接。
问题十五:删除命名空间卡在 terminating
方法一 (很可能不起作用)
kubectl delete ns sedna --force --grace-period=0
方法二:
开启一个代理终端:
kubectl proxy

Starting to serve on 127.0.0.1:8001
再开启一个操作终端:
# 将test namespace的配置文件输出保存
kubectl get ns sedna -o json > sedna.json
# 删除spec及status部分的内容还有metadata字段后的","号,切记!
sedna.json中剩下内容大致如下:
Details
{
    "apiVersion": "v1",
    "kind": "Namespace",
    "metadata": {
        "creationTimestamp": "2023-12-14T09:12:13Z",
        "deletionTimestamp": "2023-12-14T09:15:25Z",
        "managedFields": [
            {
                "apiVersion": "v1",
                "fieldsType": "FieldsV1",
                "fieldsV1": {
                    "f:status": {
                        "f:phase": {}
                    }
                },
                "manager": "kubectl-create",
                "operation": "Update",
                "time": "2023-12-14T09:12:13Z"
            },
            {
                "apiVersion": "v1",
                "fieldsType": "FieldsV1",
                "fieldsV1": {
                    "f:status": {
                        "f:conditions": {
                            ".": {},
                            "k:{\"type\":\"NamespaceContentRemaining\"}": {
                                ".": {},
                                "f:lastTransitionTime": {},
                                "f:message": {},
                                "f:reason": {},
                                "f:status": {},
                                "f:type": {}
                            },
                            "k:{\"type\":\"NamespaceDeletionContentFailure\"}": {
                                ".": {},
                                "f:lastTransitionTime": {},
                                "f:message": {},
                                "f:reason": {},
                                "f:status": {},
                                "f:type": {}
                            },
                            "k:{\"type\":\"NamespaceDeletionDiscoveryFailure\"}": {
                                ".": {},
                                "f:lastTransitionTime": {},
                                "f:message": {},
                                "f:reason": {},
                                "f:status": {},
                                "f:type": {}
                            },
                            "k:{\"type\":\"NamespaceDeletionGroupVersionParsingFailure\"}": {
                                ".": {},
                                "f:lastTransitionTime": {},
                                "f:message": {},
                                "f:reason": {},
                                "f:status": {},
                                "f:type": {}
                            },
                            "k:{\"type\":\"NamespaceFinalizersRemaining\"}": {
                                ".": {},
                                "f:lastTransitionTime": {},
                                "f:message": {},
                                "f:reason": {},
                                "f:status": {},
                                "f:type": {}
                            }
                        }
                    }
                },
                "manager": "kube-controller-manager",
                "operation": "Update",
                "time": "2023-12-14T09:15:30Z"
            }
        ],
        "name": "sedna",
        "resourceVersion": "3351515",
        "uid": "99cb8afb-a4c1-45e6-960d-ff1b4894773d"
    }
}
调用接口删除:
curl -k -H "Content-Type: application/json" -X PUT --data-binary @sedna.json http://127.0.0.1:8001/api/v1/namespaces/sedna/finalize
curl -k -H "Content-Type: application/json" -X PUT --data-binary @sedna.json http://127.0.0.1:8001/api/v1/namespaces/sedna/finalize
{
  "kind": "Namespace",
  "apiVersion": "v1",
  "metadata": {
    "name": "sedna",
    "uid": "99cb8afb-a4c1-45e6-960d-ff1b4894773d",
    "resourceVersion": "3351515",
    "creationTimestamp": "2023-12-14T09:12:13Z",
    "deletionTimestamp": "2023-12-14T09:15:25Z",
    "managedFields": [
      {
        "manager": "curl",
        "operation": "Update",
        "apiVersion": "v1",
        "time": "2023-12-14T09:42:38Z",
        "fieldsType": "FieldsV1",
        "fieldsV1": {"f:status":{"f:phase":{}}}
      }
    ]
  },
  "spec": {

  },
  "status": {
    "phase": "Terminating",
    "conditions": [
      {
        "type": "NamespaceDeletionDiscoveryFailure",
        "status": "True",
        "lastTransitionTime": "2023-12-14T09:15:30Z",
        "reason": "DiscoveryFailed",
        "message": "Discovery failed for some groups, 1 failing: unable to retrieve the complete list of server APIs: metrics.k8s.io/v1beta1: the server is currently unable to handle the request"
      },
      {
        "type": "NamespaceDeletionGroupVersionParsingFailure",
        "status": "False",
        "lastTransitionTime": "2023-12-14T09:15:30Z",
        "reason": "ParsedGroupVersions",
        "message": "All legacy kube types successfully parsed"
      },
      {
        "type": "NamespaceDeletionContentFailure",
        "status": "False",
        "lastTransitionTime": "2023-12-14T09:15:30Z",
        "reason": "ContentDeleted",
        "message": "All content successfully deleted, may be waiting on finalization"
      },
      {
        "type": "NamespaceContentRemaining",
        "status": "False",
        "lastTransitionTime": "2023-12-14T09:15:30Z",
        "reason": "ContentRemoved",
        "message": "All content successfully removed"
      },
      {
        "type": "NamespaceFinalizersRemaining",
        "status": "False",
        "lastTransitionTime": "2023-12-14T09:15:30Z",
        "reason": "ContentHasNoFinalizers",
        "message": "All content-preserving finalizers finished"
      }
    ]
  }
}
问题十六:强制删除 pod 之后部署不成功
edge 的 pod 是由 deployment 进行创建,但是通过 kubectl delete deploy <deploy-name> 删除 deployment 后,pod 一直卡在了 terminating 状态,采用 kubectl delete pod edgeworker-deployment-7g5hs-58dffc5cd7-b77wz --force --grace-period=0 命令进行删除,
重新部署时候发现 assigned to edge 的 pod 都卡在 pending 状态。
解决:
因为 --force 是不会实际终止运行的,所以本身原来的 docker 可能还在运行,现在的做法是手动去对应的边缘节点上删除对应的容器(包括 pause,关于 pause 可以看这篇文章大白话 K8S(03):从 Pause 容器理解 Pod 的本质 - 知乎 (zhihu.com)),然后重启 edgecore: systemctl restart edgecore.service。
问题十七:删除 deployment、pod 等,容器依旧自动重启
journalctl -u edgecore.service -f

解决: 重启 edgecore
systemctl restart edgecore.service
问题十八:大面积 Evicted(disk pressure)
原因:
-
node 上的 kubelet 负责采集资源占用数据,并和预先设置的 threshold 值进行比较,如果超过 threshold 值,kubelet 会杀掉一些 Pod 来回收相关资源,K8s官网解读kubernetes配置资源不足处理。
-
默认启动时,node 的可用空间低于15%的时候,该节点上讲会执行 eviction 操作,由于磁盘已经达到了85%,在怎么驱逐也无法正常启动就会一直重启,Pod 状态也是 pending 中。
解决:
根本解决方案是增大磁盘可用空间。
如果需要临时解决,可以通过修改k8s配置来更改threshold。
修改配置文件增加传参数,添加此配置项--eviction-hard=nodefs.available<5%。
systemctl status kubelet

● kubelet.service - kubelet: The Kubernetes Node Agent
     Loaded: loaded (/lib/systemd/system/kubelet.service; enabled; vendor preset: enabled)
    Drop-In: /etc/systemd/system/kubelet.service.d
             └─10-kubeadm.conf
     Active: active (running) since Fri 2023-12-15 09:17:50 CST; 5min ago
       Docs: https://kubernetes.io/docs/home/
   Main PID: 1070209 (kubelet)
      Tasks: 59 (limit: 309024)
     Memory: 67.2M
     CGroup: /system.slice/kubelet.service
可以看到配置文件目录所在位置是 /etc/systemd/system/kubelet.service.d,配置文件是 10-kubeadm.conf。
vim /etc/systemd/system/kubelet.service.d/10-kubeadm.conf

[Service]
Environment="KUBELET_KUBECONFIG_ARGS=--bootstrap-kubeconfig=/etc/kubernetes/bootstrap-kubelet.conf --kubeconfig=/etc/kubernetes/kubelet.conf"
Environment="KUBELET_CONFIG_ARGS=--config=/var/lib/kubelet/config.yaml --eviction-hard=nodefs.available<5%"

# 最后添加上--eviction-hard=nodefs.available<5%
重启 kubelet:
systemctl daemon-reload
systemctl  restart kubelet
之后可以正常部署(只是应急措施,磁盘空间需要再清理)。
问题十九:执行 iptables 命令时发现系统不支持--dport选项
执行命令:iptables -t nat -A OUTPUT -p tcp --dport 10351 -j DNAT --to $CLOUDCOREIPS:10003时报错信息中指出系统不支持--dport选项,这是因为iptables版本不支持。
使用iptables -V查看版本,如果是iptables v1.8.7 (nf_tables),说明需要更改版本,因为nf_tables版本不支持--dport选项。
解决:
# 切换版本,执行此命令会提供3个可供选择的版本,其中编号为1的就是legacy版本(必须用sudo权限才能切换成功)
sudo update-alternatives --config iptables

# 验证,无报错输出即为成功
iptables -t nat -A OUTPUT -p tcp --dport 10351 -j DNAT --to $CLOUDCOREIPS:10003
问题二十:执行完keadm join再执行journalctl时报错token format错误
执行命令:keadm join --cloudcore-ipport=114.212.81.11:10000 --kubeedge-version=1.9.2 --token=xxx,再执行journalctl -u edegecore.service -f命令后,报错信息指出token format有问题。
解决:
要么是因为cloudcore.service重启后token变化导致keadm join中的token过时,要么是因为执行keadm join的时候token输入的不对。
此时,首先在云端重新获取正确的token,然后在边端从keadm reset开始重新执行一系列操作。
问题二十一:重启edgecore.service后再执行journalctl时报错mapping error
在执行EdgeMesh启动阶段,修改/etc/kubeedge/config/edgecore.yaml文件,再用systemctl restart edgecore.service重启服务,执行journalctl -u edegecore.service -f查看log发现报错信息指出当前存在mapping error,yaml无法转化为json。
解决:
检查/etc/kubeedge/config/edgecore.yaml文件内的格式问题,特别注意yaml文件中不能用tab缩进,必需用空格。
问题二十二:重启edgecore.service后再执行journalctl时报错connect refuse
在执行EdgeMesh启动阶段,修改/etc/kubeedge/config/edgecore.yaml文件,再用systemctl restart edgecore.service重启服务,执行journalctl -u edegecore.service -f查看log发现报错信息指出connect refuse,云端拒绝通信。
解决:
检查云端cloudcore状态:
# 检查cloudcore状态,确保正常运行
systemctl status cloudcore
# 重启cloudcore服务
systemctl restart cloudcore.service
# 查看报错信息
journalctl -u cloudcore.service -f
此时,很有可能发现问题四。
问题二十三:部署metrics-service时遇到Shutting down相关问题
部署metrics-service过程中按照文档中修改components.yaml文件中端口号为4443,但后续metrics-service运行失败,
产生Shutting down RequestHeaderAuthRequestController等相关错误。
解决:
在部署KubeEdge时,metrics-service参数中暴露的端口会被自动覆盖为10250端口,components.yaml文件中的端口参数应当与后续实际服务
所在的端口一致,手动修改参数中的端口为10250即可。
问题二十四:169.254.96. 16:53: i/o timeout
集群新加入节点,KubeEdge的edgemesh以及sedna等组件会自动部署,但查看lc的log发现报错:
client tries to connect global manager(address: gm.sedna:9000) failed, error: dial tcp: lookup gm.sedna on 169.254.96.16:53: read udp 172.17.0.3:49991->169.254.96.16:53: i/o timeout
排查:
由于是pod与edgemesh-agent的交互问题,首先检查该edge上的edgemesh-agent的状态,发现会是edgemesh-agent的问题:
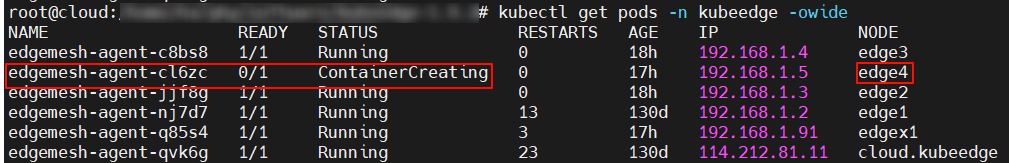
通过kubectl describe pod <pod-name>发现该pod被分配到新edge后就没有其余事件记录:
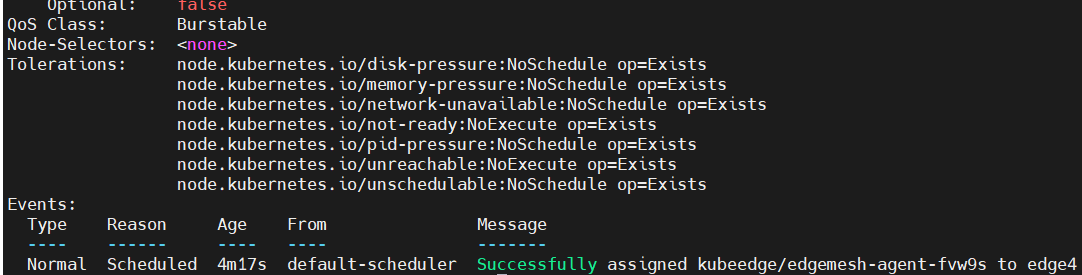
可以去edge上查看信息,通过journalctl -u edgecore.service -xe可以看到相关报错:

原因: dockerhub无法直接访问,新加入的edge没有做镜像源等对应配置,导致拉取不到镜像。
解决: 配置后重启docker和edgecore即可,具体配置详见Docker镜像源配置。
问题二十五:边端join报错
边端执行keadm join报错。
解决:
检查edgecore.yaml文件:
vim /etc/kubeedge/config/edgecore.yaml
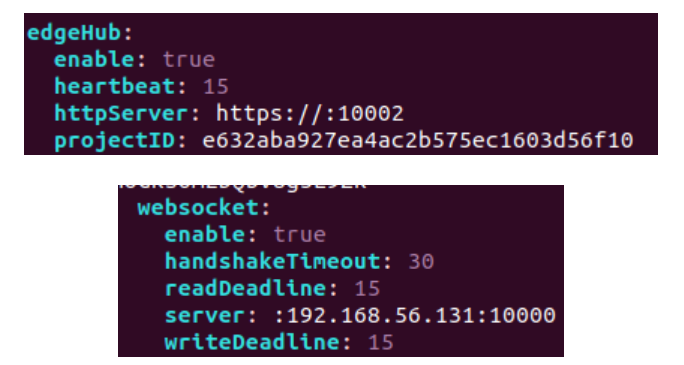
edgeHub中的httpServer添加云端地址(例如https://114.212.81.11:10002),同时websocket中的server删除多余的:,修改完后重新执行keadm join指令。
问题二十六:failed to build map of initial containers from runtime
在journalctl -u edgecore.service -f时 edgecore 报告错误如下:
initialize module error: failed to build map of initial containers from runtime: no PodsandBox found with Id 'c45ed1592e75e885e119664d777107645a7e7904703c690664691c61a9f79ed3'
解决:
找到对应的docker ID并删除:
docker ps -a --filter "label=io.kubernetes.sandbox.id=c45ed1592e75e885e119664d777107645a7e7904703c690664691c61a9f79ed3"
# find the related docker ID
docker rm <docker ID>
问题二十七:Certificate has expired or is not yet valid
执行 kubectl get pods -A 命令时遇到如下报错:
Unable to connect to the server: x509: certificate has expired or is not yet valid: current time 2025-06-27T22:23:12+08:00 is after 2025-06-27T08:56:50Z
原因:
在云服务器上检查证书:
sudo kubeadm certs check-expiration

# 得到如下结果:
[check-expiration] Reading configuration from the cluster...
[check-expiration] FYI: You can look at this config file with 'kubectl -n kube-system get cm kubeadm-config -o yaml'
[check-expiration] Error reading configuration from the Cluster. Falling back to default configuration

CERTIFICATE                EXPIRES                  RESIDUAL TIME   CERTIFICATE AUTHORITY   EXTERNALLY MANAGED
admin.conf                 Jun 27, 2025 08:56 UTC   <invalid>                               no
apiserver                  Jun 27, 2025 08:56 UTC   <invalid>       ca                      no
apiserver-etcd-client      Jun 27, 2025 08:56 UTC   <invalid>       etcd-ca                 no
apiserver-kubelet-client   Jun 27, 2025 08:56 UTC   <invalid>       ca                      no
controller-manager.conf    Jun 27, 2025 08:56 UTC   <invalid>                               no
etcd-healthcheck-client    Jun 27, 2025 08:56 UTC   <invalid>       etcd-ca                 no
etcd-peer                  Jun 27, 2025 08:56 UTC   <invalid>       etcd-ca                 no
etcd-server                Jun 27, 2025 08:56 UTC   <invalid>       etcd-ca                 no
front-proxy-client         Jun 27, 2025 08:56 UTC   <invalid>       front-proxy-ca          no
scheduler.conf             Jun 27, 2025 08:56 UTC   <invalid>                               no

CERTIFICATE AUTHORITY   EXPIRES                  RESIDUAL TIME   EXTERNALLY MANAGED
ca                      Jun 25, 2034 08:56 UTC   8y              no
etcd-ca                 Jun 25, 2034 08:56 UTC   8y              no
front-proxy-ca          Jun 25, 2034 08:56 UTC   8y              no
可以看到证书的状态都是 <invalid> 过期状态。
解决:
更新 Kubernetes 证书
sudo kubeadm certs renew all

# 得到如下结果:
[renew] Reading configuration from the cluster...
[renew] FYI: You can look at this config file with 'kubectl -n kube-system get cm kubeadm-config -o yaml'
[renew] Error reading configuration from the Cluster. Falling back to default configuration

certificate embedded in the kubeconfig file for the admin to use and for kubeadm itself renewed
certificate for serving the Kubernetes API renewed
certificate the apiserver uses to access etcd renewed
certificate for the API server to connect to kubelet renewed
certificate embedded in the kubeconfig file for the controller manager to use renewed
certificate for liveness probes to healthcheck etcd renewed
certificate for etcd nodes to communicate with each other renewed
certificate for serving etcd renewed
certificate for the front proxy client renewed
certificate embedded in the kubeconfig file for the scheduler manager to use renewed

Done renewing certificates. You must restart the kube-apiserver, kube-controller-manager, kube-scheduler and etcd, so that they can use the new certificates.
重新检查证书状态,可以看到所有证书都已被更新
sudo kubeadm certs check-expiration

# 得到如下结果:
[check-expiration] Reading configuration from the cluster...
[check-expiration] FYI: You can look at this config file with 'kubectl -n kube-system get cm kubeadm-config -o yaml'
[check-expiration] Error reading configuration from the Cluster. Falling back to default configuration

CERTIFICATE                EXPIRES                  RESIDUAL TIME   CERTIFICATE AUTHORITY   EXTERNALLY MANAGED
admin.conf                 Jun 27, 2026 14:30 UTC   364d                                    no
apiserver                  Jun 27, 2026 14:30 UTC   364d            ca                      no
apiserver-etcd-client      Jun 27, 2026 14:30 UTC   364d            etcd-ca                 no
apiserver-kubelet-client   Jun 27, 2026 14:30 UTC   364d            ca                      no
controller-manager.conf    Jun 27, 2026 14:30 UTC   364d                                    no
etcd-healthcheck-client    Jun 27, 2026 14:30 UTC   364d            etcd-ca                 no
etcd-peer                  Jun 27, 2026 14:30 UTC   364d            etcd-ca                 no
etcd-server                Jun 27, 2026 14:30 UTC   364d            etcd-ca                 no
front-proxy-client         Jun 27, 2026 14:30 UTC   364d            front-proxy-ca          no
scheduler.conf             Jun 27, 2026 14:30 UTC   364d                                    no

CERTIFICATE AUTHORITY   EXPIRES                  RESIDUAL TIME   EXTERNALLY MANAGED
ca                      Jun 25, 2034 08:56 UTC   8y              no
etcd-ca                 Jun 25, 2034 08:56 UTC   8y              no
front-proxy-ca          Jun 25, 2034 08:56 UTC   8y              no
然而,再次执行命令 kubectl get pods -A 仍然得到如下报错:
error: You must be logged in to the server (Unauthorized)
通过更新配置文件并重启 kubelet 来解决问题:
# 备份配置文件
cp -rp $HOME/.kube/config $HOME/.kube/config.bak

# 更新配置文件
sudo cp -i /etc/kubernetes/admin.conf $HOME/.kube/config

# 重启 kubelet
sudo systemctl restart kubelet
# 重启 kube-apiserver, kube-controller-manage, kube-scheduler
docker ps |grep kube-apiserver|grep -v pause|awk '{print $1}'|xargs -i docker restart {}
docker ps |grep kube-controller-manage|grep -v pause|awk '{print $1}'|xargs -i docker restart {}
docker ps |grep kube-scheduler|grep -v pause|awk '{print $1}'|xargs -i docker restart {}
重启 Cloudcore 并检查状态:
# 重启 Cloudcore
sudo systemctl restart cloudcore
# 查看 Cloudcore 状态
systemctl status cloudcore
journalctl -u cloudcore -xe
如果 Cloudcore 存在以下错误:
cloudcore.service: Main process exited, code=exited, status=2/INVALIDARGUMENT
cloudcore.service: Main process exited, code=exited, status=2/INVALIDARGUMENT
-- A start job for unit cloudcore.service has finished successfully.
--
-- The job identifier is 2357999.
6月 30 00:45:15 cloud.kubeedge cloudcore[3159196]: W0630 00:45:15.125171 3159196 validation.go:154] TLSTunnelPrivateKeyFile does not exist i>
6月 30 00:45:15 cloud.kubeedge cloudcore[3159196]: W0630 00:45:15.125269 3159196 validation.go:157] TLSTunnelCertFile does not exist in /etc>
6月 30 00:45:15 cloud.kubeedge cloudcore[3159196]: W0630 00:45:15.125286 3159196 validation.go:160] TLSTunnelCAFile does not exist in /etc/k>
6月 30 00:45:15 cloud.kubeedge cloudcore[3159196]: I0630 00:45:15.125336 3159196 server.go:77] Version: v1.9.2
6月 30 00:45:16 cloud.kubeedge cloudcore[3159196]: panic: failed to create system namespace
6月 30 00:45:16 cloud.kubeedge cloudcore[3159196]: goroutine 1 [running]:
6月 30 00:45:16 cloud.kubeedge cloudcore[3159196]: github.com/kubeedge/kubeedge/cloud/cmd/cloudcore/app.NewCloudCoreCommand.func1(0xc00035f8>
6月 30 00:45:16 cloud.kubeedge cloudcore[3159196]:         /root/kubeedge/cloud/cmd/cloudcore/app/server.go:85 +0x81c
6月 30 00:45:16 cloud.kubeedge cloudcore[3159196]: github.com/spf13/cobra.(*Command).execute(0xc00035f8c0, 0xc00003c1f0, 0x0, 0x0, 0xc00035f>
6月 30 00:45:16 cloud.kubeedge cloudcore[3159196]:         /root/kubeedge/vendor/github.com/spf13/cobra/command.go:854 +0x2c2
6月 30 00:45:16 cloud.kubeedge cloudcore[3159196]: github.com/spf13/cobra.(*Command).ExecuteC(0xc00035f8c0, 0xc000180058, 0x1859280, 0x0)
6月 30 00:45:16 cloud.kubeedge cloudcore[3159196]:         /root/kubeedge/vendor/github.com/spf13/cobra/command.go:958 +0x375
6月 30 00:45:16 cloud.kubeedge cloudcore[3159196]: github.com/spf13/cobra.(*Command).Execute(...)
6月 30 00:45:16 cloud.kubeedge cloudcore[3159196]:         /root/kubeedge/vendor/github.com/spf13/cobra/command.go:895
6月 30 00:45:16 cloud.kubeedge cloudcore[3159196]: main.main()
6月 30 00:45:16 cloud.kubeedge cloudcore[3159196]:         /root/kubeedge/cloud/cmd/cloudcore/cloudcore.go:16 +0x65
6月 30 00:45:16 cloud.kubeedge systemd[1]: cloudcore.service: Main process exited, code=exited, status=2/INVALIDARGUMENT
-- Subject: Unit process exited
-- Defined-By: systemd
-- Support: http://www.ubuntu.com/support
--
-- An ExecStart= process belonging to unit cloudcore.service has exited.
--
-- The process' exit code is 'exited' and its exit status is 2.
6月 30 00:45:16 cloud.kubeedge systemd[1]: cloudcore.service: Failed with result 'exit-code'.
-- Subject: Unit failed
-- Defined-By: systemd
-- Support: http://www.ubuntu.com/support
--
-- The unit cloudcore.service has entered the 'failed' state with result 'exit-code'.
则需要更新 Cloudcore 的证书:
# 修改 '--adverse-address' 的IP地址
keadm init --advertise-address=114.212.81.11 --kubeedge-version=1.9.2

# 查看 Cloudcore 状态
journalctl -u cloudcore -xe

# 如果 Cloudcore 的日志存在端口占用错误,则强制关闭占用端口进程
sudo lsof -i:<port>
sudo kill -9 <pid>
请注意, keadm init后需要按照【安装 KubeEdge】章节的内容重新修改 cloudcore.yaml 文件。
问题二十八:大禹系统容器中出现 Connection refused
在大禹系统容器中, connection refused 错误出现,然而对应的 pod 却正常且日志无网络连接记录。
原因:
在边缘节点上检查 edgemesh-agent 状态:
kubectl get pods -n kubeedge -owide
kubectl logs -n kubeedge edgemesh-agent-xxxxx # xxxxx 是pod名
从 edgemesh-agent 的日志中,我们可以看出存在 service port 冲突,然后我们在边缘设备上检查 iptables:
sudo iptables -t nat -nvL
冗余的规则记录在 iptables 中 KUBE-NODEPORT-CONTAINER、KUBE-NODEPORT-HOST、KUBE-PORTALS-CONTAINER、KUBE-PORTALS-HOST项中 (来自于关闭大禹系统时的残余记录)。
解决:
临时解决方案是清空边缘节点上 edgecore 的数据库(这可能导致数据丢失):
# 停止 edgecore
sudo systemctl stop edgecore
# 备份 kuebedge 数据
sudo tar -czf /tmp/kubeedge-backup-$(date +%F-%H%M%S).tgz /var/lib/kubeedge
# 清空 kubeedge 数据库
sudo rm -rf /var/lib/kubeedge
sudo mkdir -p /var/lib/kubeedge
sudo chown -R root:root /var/lib/kubeedge
# 启动 edgecore
sudo systemctl start edgecore
# 检查 edgecore 状态
sudo journalctl -u edgecore -f --no-pager
另一种临时解决方案是参照文档在边缘节点上重新安装 KubeEdge 。
该问题已在大禹v1.3版本被永久解决,使用最新的大禹启动脚本可以避免此问题。